7.2 KiB
Creating and Editing Python Files
Installing a Text Editor
A text editor is a type of program that (unsurprisingly) lets you edit text. Code is just text after all, so picking a good text editor is important to making writing code easier. There are plenty of good (and just as many bad) options available, so feel free to do some research. Personally, I use Vim and Neovim, which have a steep learning curve, but run really fast and allow for efficient edits. For the purposes of this exercise, however, I recommend Visual Studio Code (VS Code).
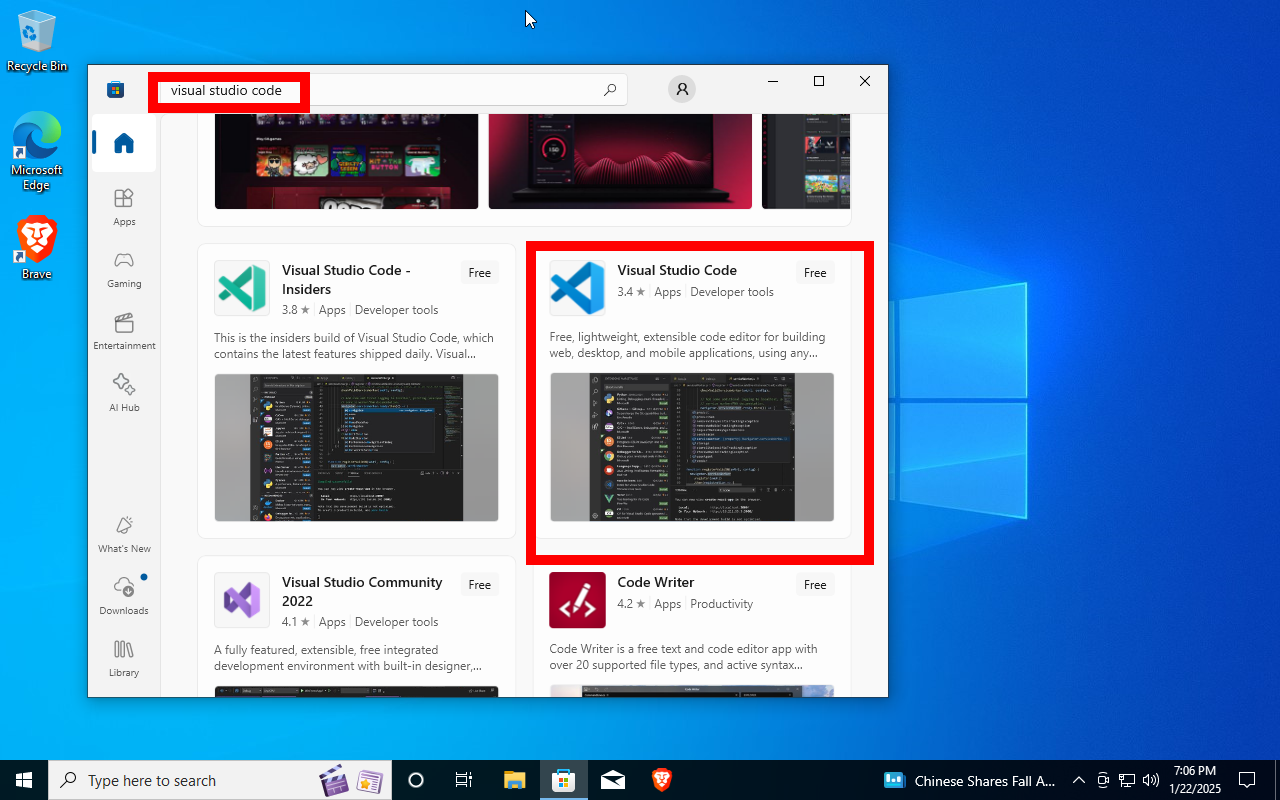
To install VS Code, first open the Microsoft Store and search for visual studio code. Select the one called "Visual Studio Code". You should not install the Insiders edition or Visual Studio Community 2022.
\newpage
Open VS Code
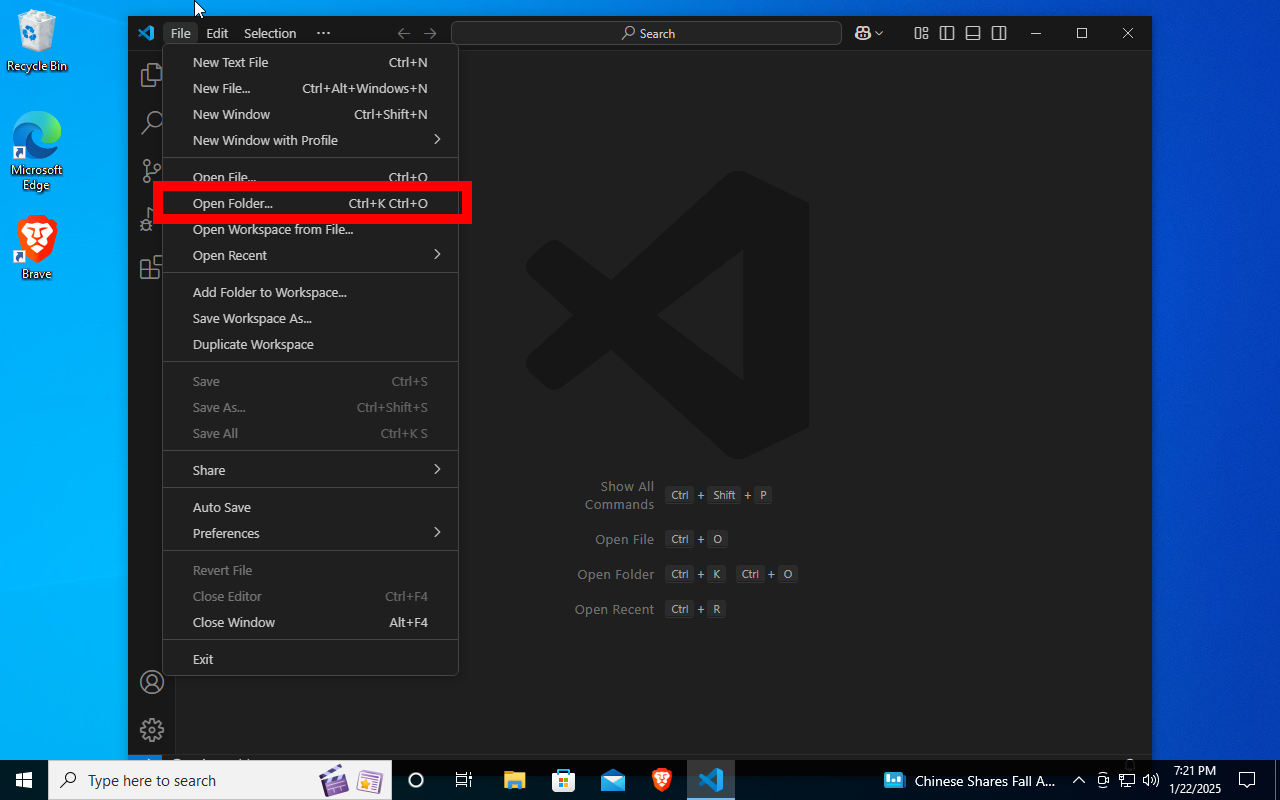
Open VS Code, and click File$\to$Open Folder.
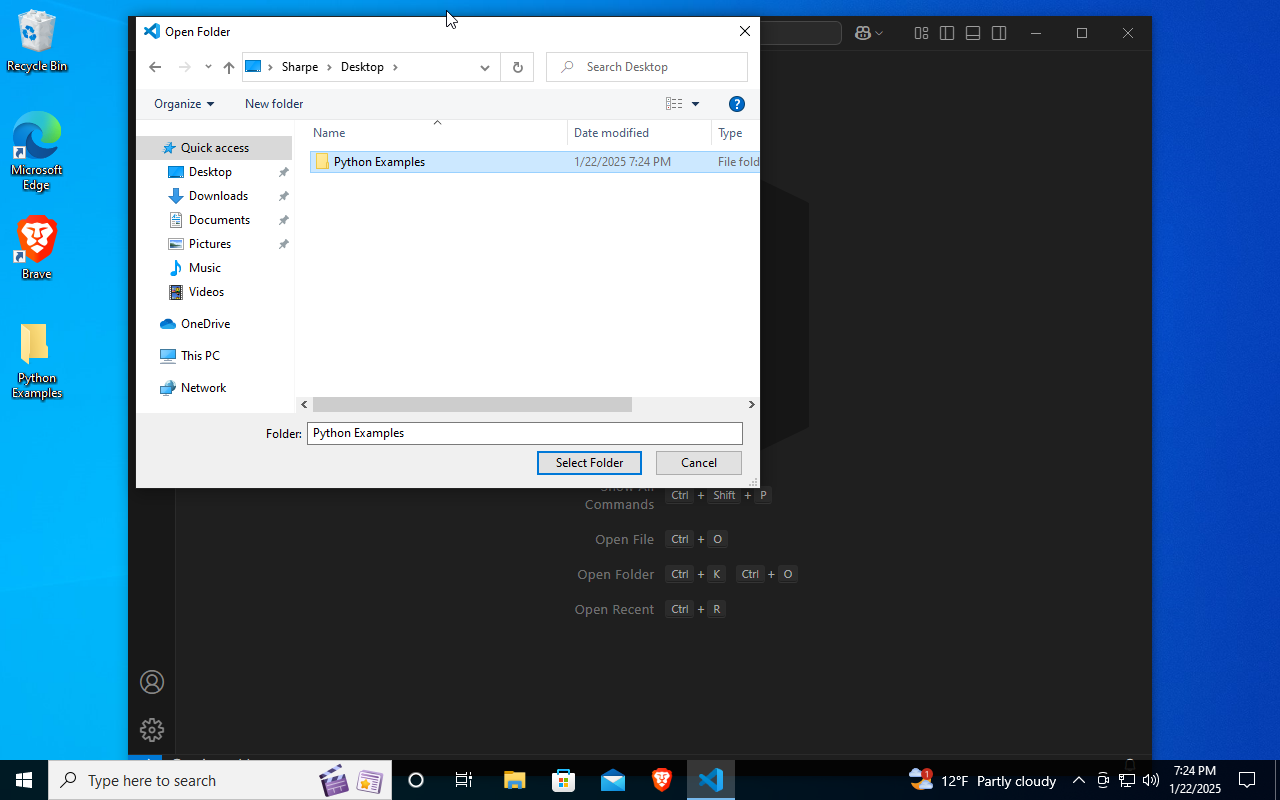
Then, create and open a folder for your Python example files. This will be the folder we work in for all exercises. I recommend that you use a separate folder for your lab-related Python files, maybe even a separate folder for each lab. Once you click "Select Folder" you may get a pop-up asking you if you trust this folder. It's your folder, so you can trust it no problem.
\newpage
Creating Your First Python File
Hover over the "Explorer" panel, and click the "New File" button. Call the file "example1.py" or something similar. It is important to make sure the file ends with .py, so it is recognized as a Python file.
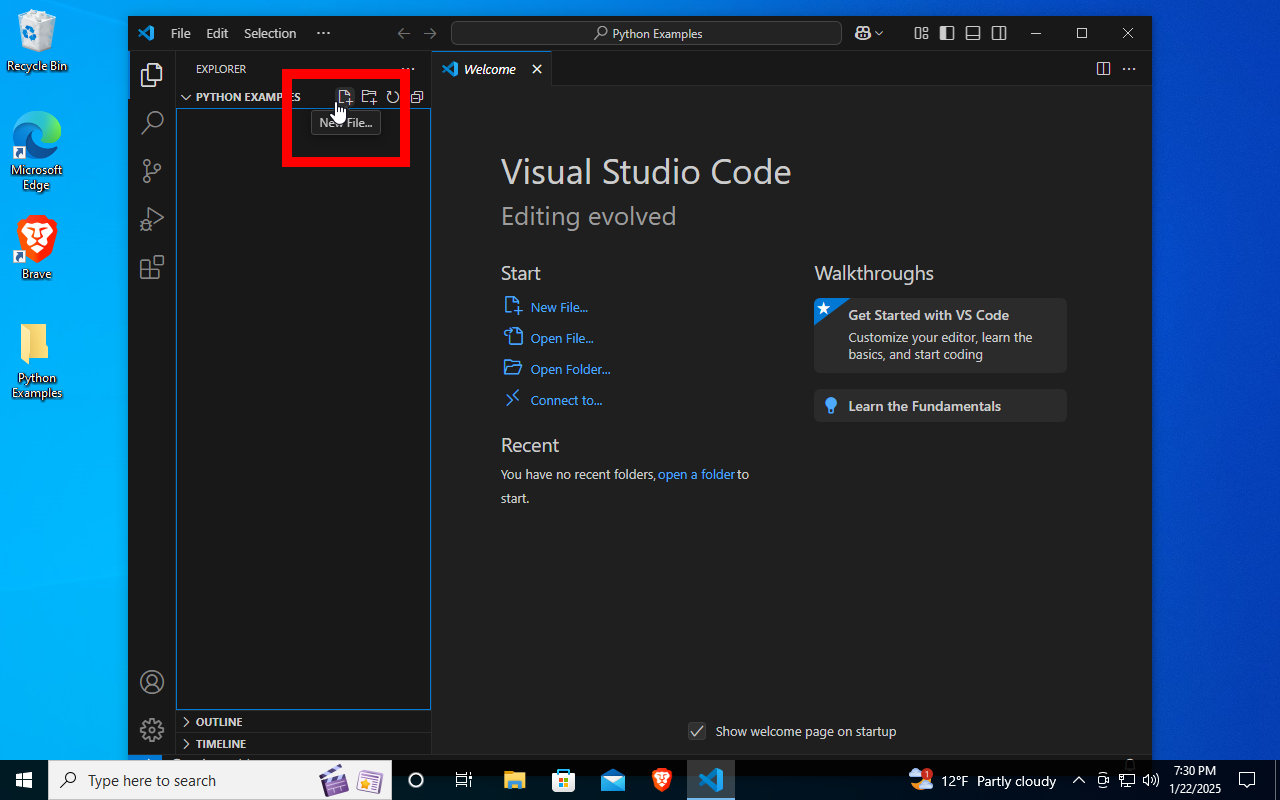
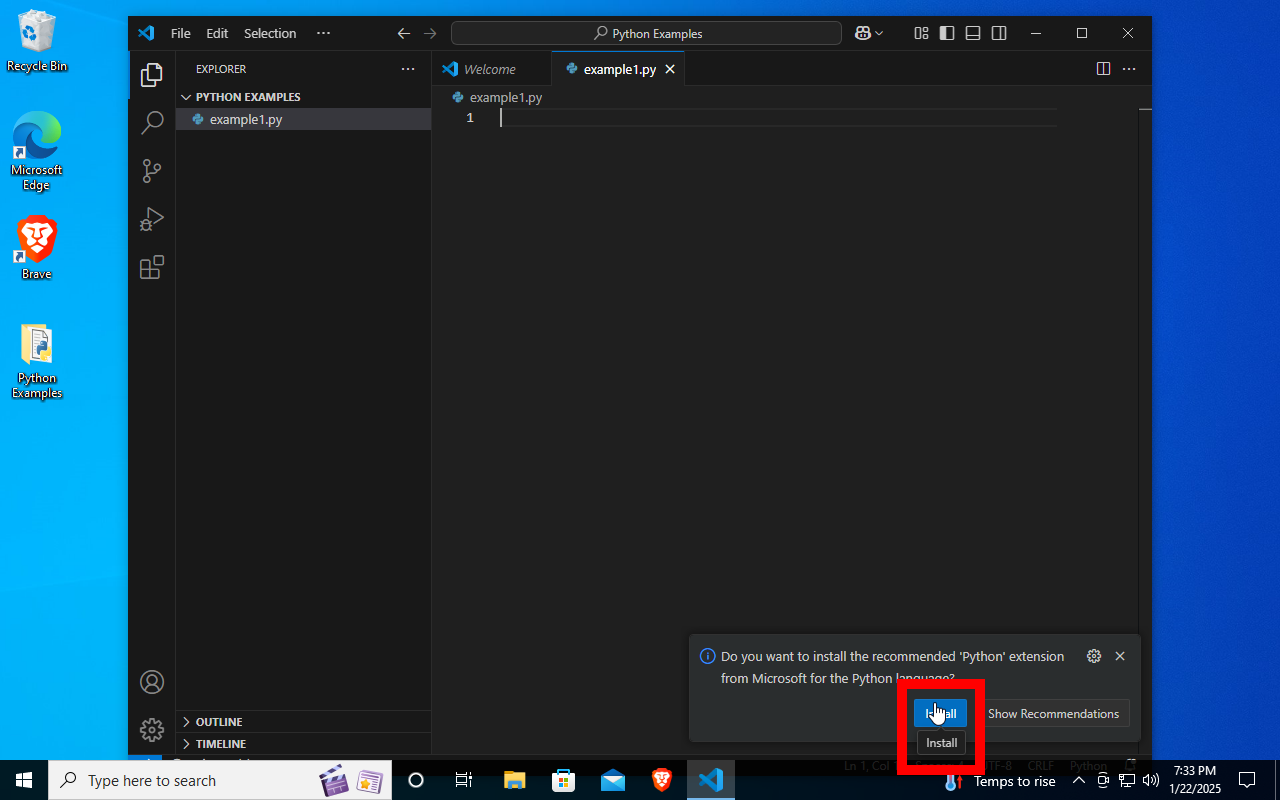
You should get a pop-up in the bottom right corner asking you if you want to install the Python extension. Go ahead and click the "Install" button to install the extension. This extension will add special tools to aid you in developing and running Python. Once it is done installing, close the tab, and switch to the tab for the Python file you previously created.
\newpage
Writing a Python Program in a File
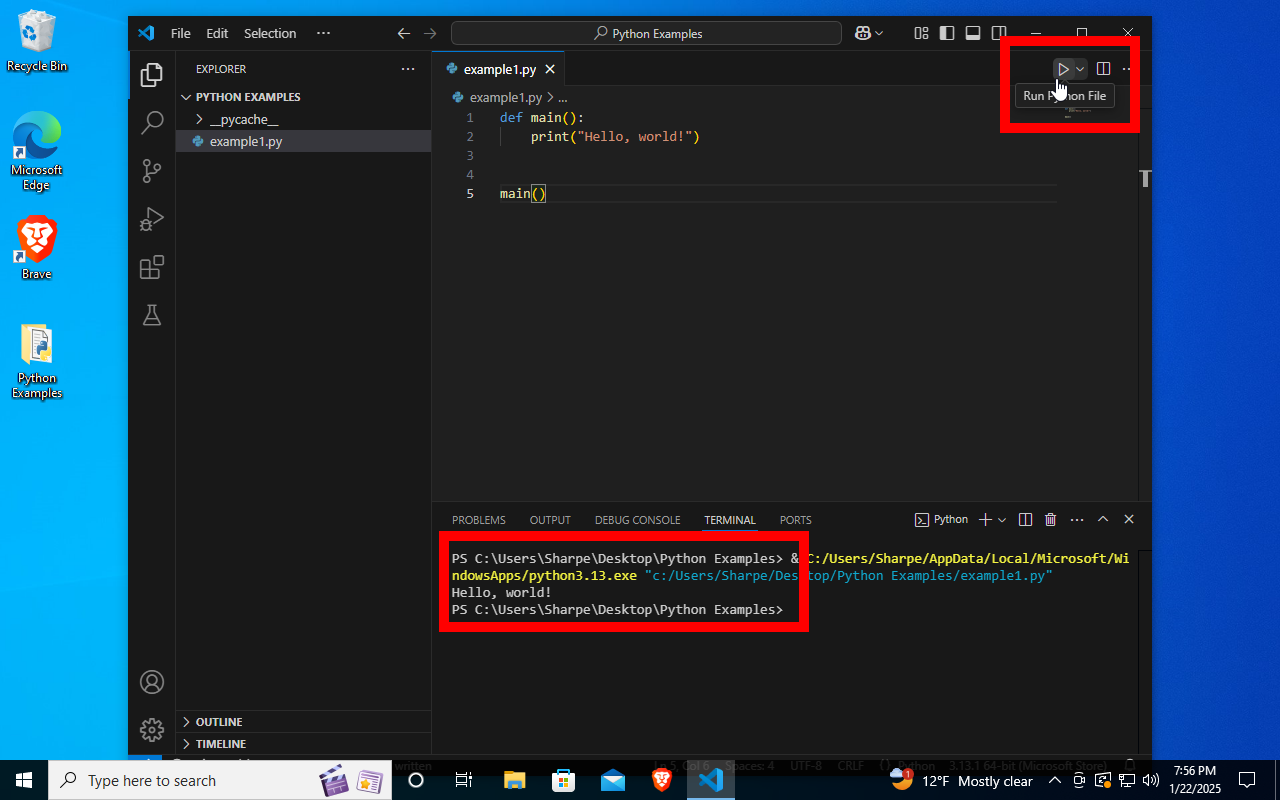
Copy the code from the image below to create a simple "hello world" program. This program defines the main() function that, when called, prints the text "Hello, world!" to the console. Then on line 5, we call the main() function. Once you are done copying, click the play button in the upper-right corner. The output from your code will show up in the terminal at the bottom of your screen.
\newpage
The import Statement
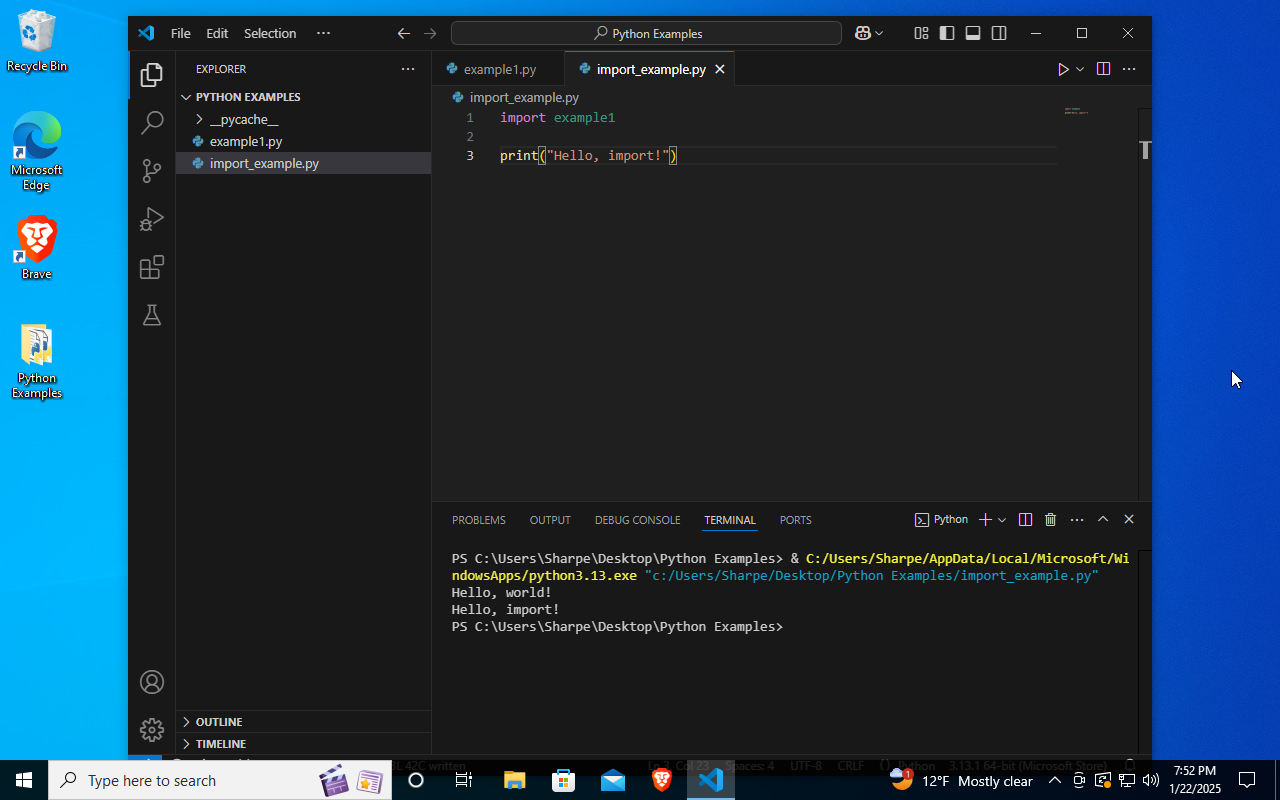
Make a new file called "import_example.py" and copy the code from the image below. Again, click the play button to run your code. Notice that "Hello world!" was printed to the console even though we did not call the main() function directly from import_example.py. This was done because the import keyword both loads and runs the file being imported.
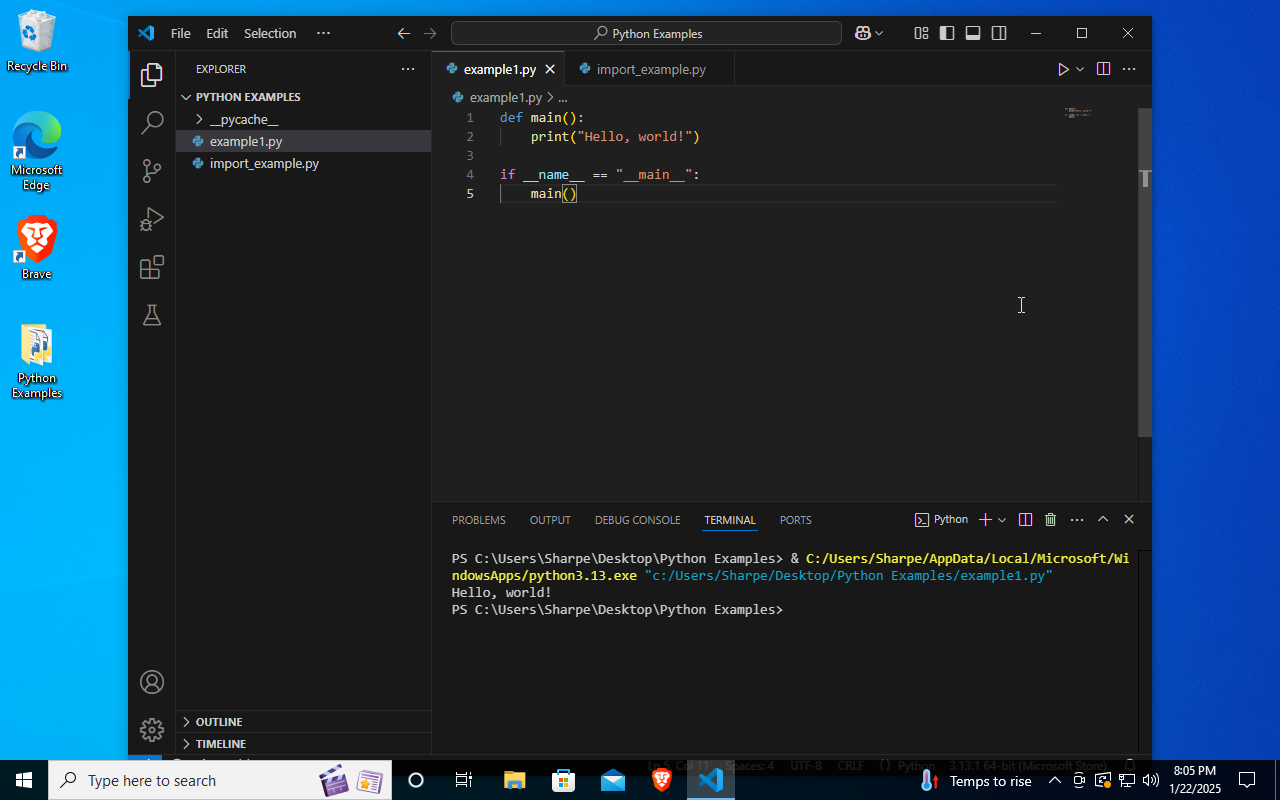
To fix this behavior, so we have to call the main() function explicitly from files that import example1.py, we can add the following code to our original file:
Please note that __name__ and "__main__" have a double underscore before and after. These double underscore are special Python attributes called "dunder attributes". The __name__ attribute is set by whichever file is doing the importing. In the example above, import_example.py was importing example1.py. When the file is run directly, the __name__ attribute is set to "__main__". In this way, we can actually create different behavior depending on whether or not the file is being run directly or being imported by another file. This can be a super helpful tool when debugging your code, so you will often see if __name__ == "__main__": in files that are meant to be executed directly.
Installing Libraries
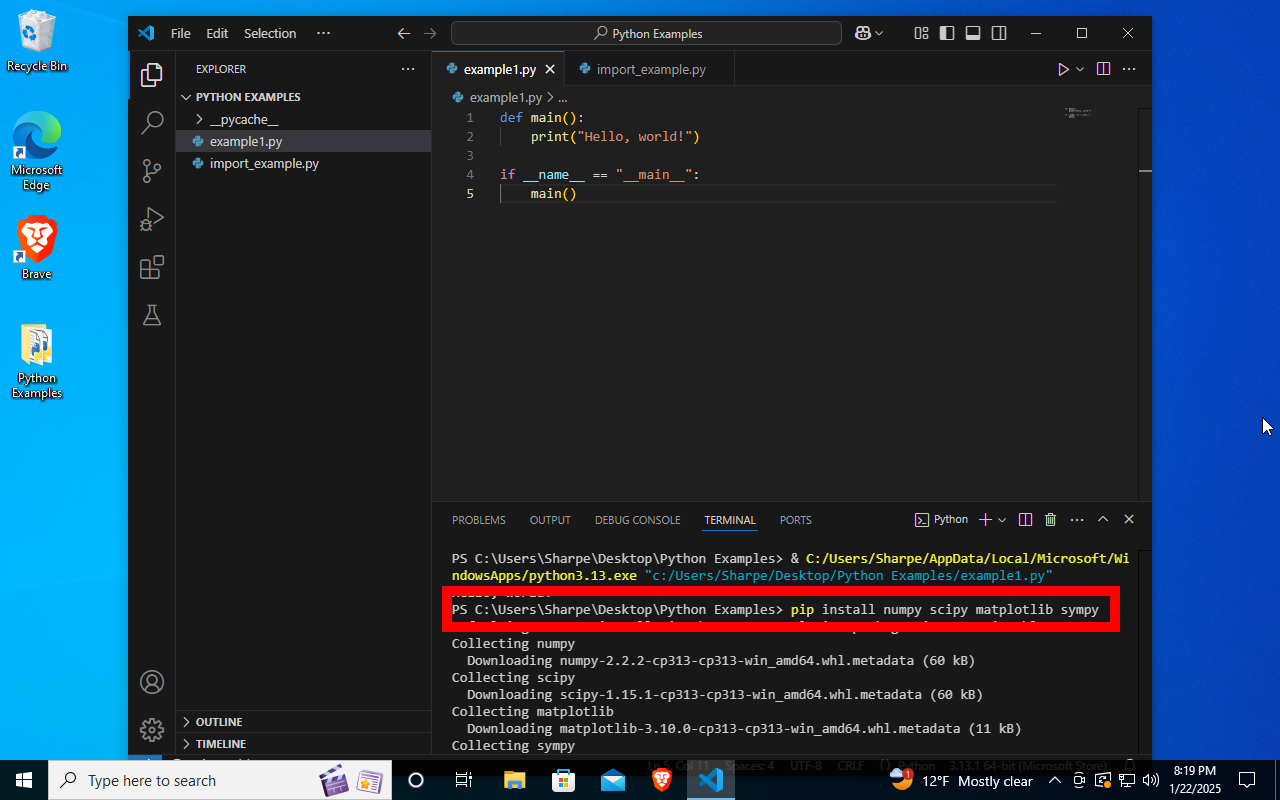
For your labs, we will be using several libraries to make doing DSP-specific tasks easier and faster. These libraries are numpy, scipy, matplotlib, and sympy. To install them, we use pip---the package installer for Python. In the terminal at the bottom of your screen type the command:
pip install numpy scipy matlotlib sympy
and hit the "enter" key to execute it. Wait for the packages to install, and you're done!
If you get an error message saying that the pip command doesn't exist, try the command:
python -m pip install numpy scipy matplotlib sympy
\newpage
Creating Your First Plot
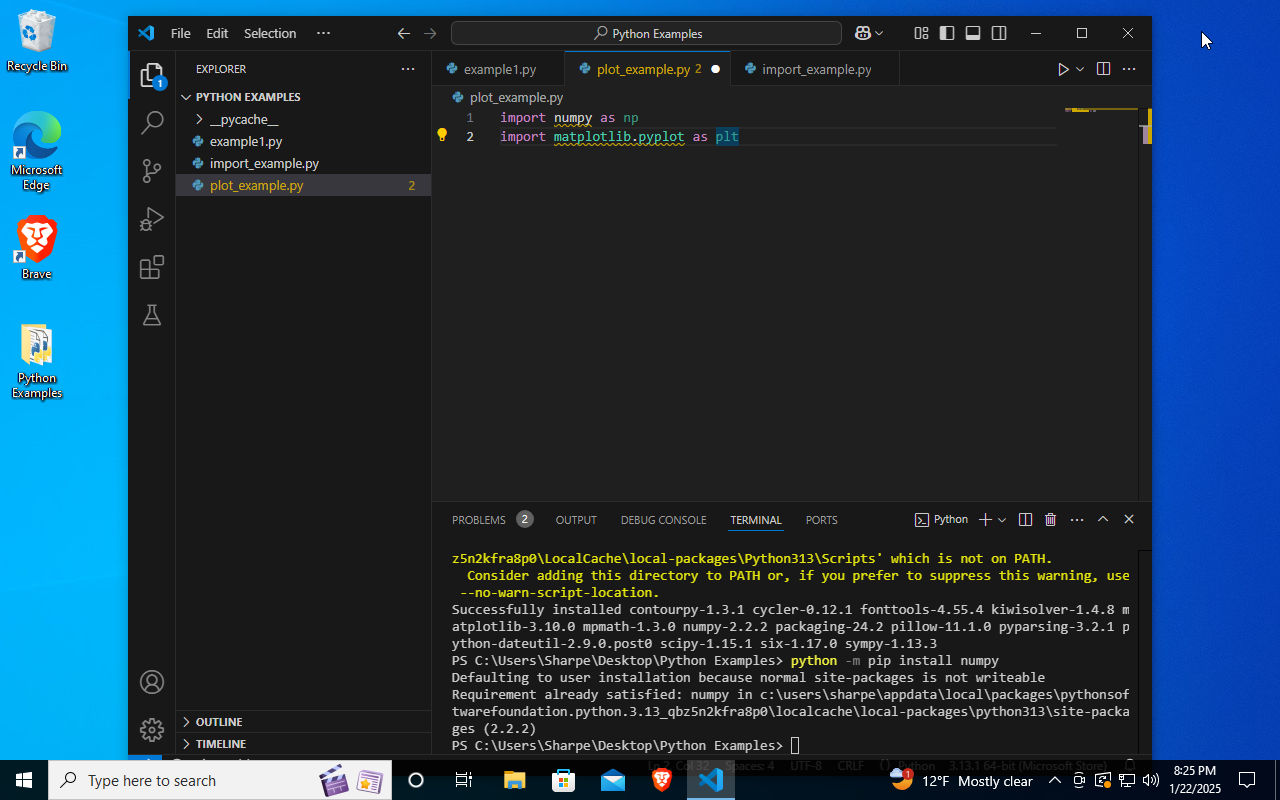
To make a plot in Python, we will start by making a new file called plot_example.py. We will use two libraries to make our plot: numpy for array creation and manipulation and matplotlib for drawing the plot. To use the libraries, we import them. To make using the libraries easer, we can give them aliases. It is standard to use np as the alias for numpy and plt for matplotlib.pyplot. This reduces the amount of typing we have to do while writing the program without losing any meaning or clarity. To make an alias we use the as keyword as shown below:
\newpage
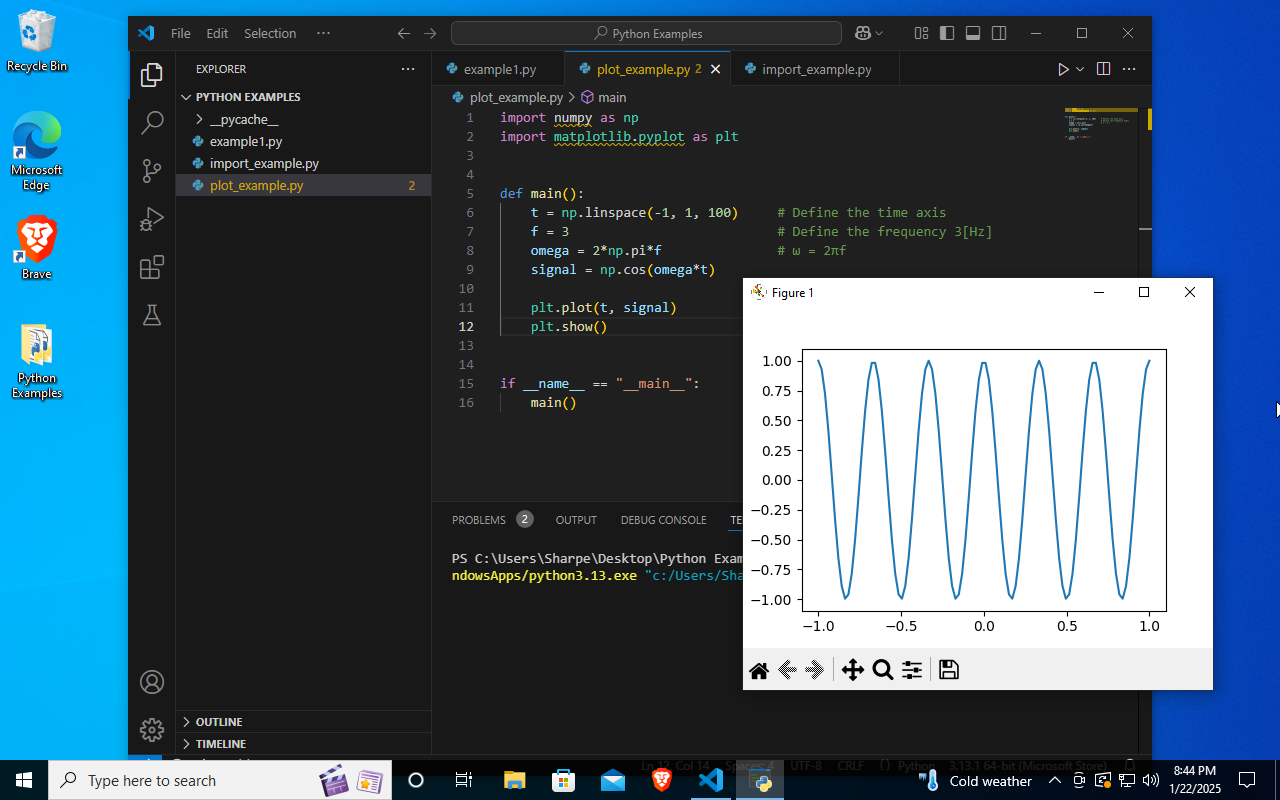
Now that we can use the libraries in our code, we will actually make our plot. We start by defining our time (horizontal) axis as 100 evenly spaced points between -1 and 1 using the function np.linspace(-1, 1, 100). I chose to plot a cosine, so we will need a frequency of oscillation. We can define our frequency with a variable and convert it to angular frequency and store that in another variable. The numpy library has special functions like np.cos() that return a new array containing the cosine of every element in the input array. We can then plot the signal-vs-time using the plt.plot(horiz, vert) function. This will create a line graph, but since we have 100 points, it will appear as a smooth curve. To actually show the graph, we need to call another function plt.show(). This function shows the current figure in a window, so we can see it. Copy the code shown below, and run it to see the plot.
Sampling
In digital systems, we do not have access to continuous functions. Instead, we only have samples. To create a time axis that uses a set sampling period T_s instead of a set number of points, we can use the np.arange(lower_bound, upper_bound, T_s) function. We typically use the plt.stem() function instead of the plt.plot() function to better show the individual samples. As an exercise, try to re-write the original example plot using the minimum sampling frequency that does not result in aliasing. Hint: what is the relationship between sampling frequency and sampling period?
\newpage
Closing
Now we have a text editor and all the libraries we will need for the course installed. We also learned how to create and run Python files, and how to use the import keyword. Finally, we learned a little bit about using the numpy and matplotlib libraries. For the official documentation for each of the libraries see the table below:
| Library Name | Doc Website |
|---|---|
| Numpy | numpy.org |
| Scipy | scipy.org |
| Matplotlib | matlotlib.org |
| Sympy | sympy.org |
