4.8 KiB
4.8 KiB
title: Homework 1
author: Aidan Sharpe
date: February 10th, 2025
geometry: margin=1in
output:
pdf_document:
md_extension: native_numbering
Determining
Develop an Atmospheric Model
import numpy as np
import matplotlib.pyplot as plt


def temperature(altitude):
    if altitude > 25000:
        return -131.21 + 0.00299*altitude
    elif altitude > 11000:
        return -56.46
    else:
        return 15.04 - 0.00649*altitude


def pressure(altitude):
    T = temperature(altitude)
    if altitude > 25000:
        kpa = 2.488 * ((T+273.1)/216.6)**(-11.388)
    elif altitude > 11000:
        kpa = 22.65 * np.exp(1.73 - 0.000157*alititude)
    else:
        kpa = 101.29 * ((T+273.1)/288.08)**5.256
    return 1000*kpa

def atmospheric_density(altitude):
    p = pressure(altitude)
    T = temperature(altitude)
    return p / (286.9*(T+273.1))


def Mach(altitude, speed):
    return speed/speed_of_sound(altitude)


def speed_of_sound(altitude):
    gamma = 1.4
    p = pressure(altitude)
    rho = atmospheric_density(altitude)
    return (gamma*p/rho)**0.5


def dynamic_pressure(altitude, speed):
    rho = atmospheric_density(altitude)
    return rho * speed**2 / 2
Determining C_{N_\alpha}
import numpy as np
import atmospheric_model as atmos

M = 400
D = 0.1
alpha = np.radians(40)
g = 9.81
a = 30*g
alt = 5000
v = 600

N = M*a
S_ref = np.pi * (D/2)**2
Q = atmos.dynamic_pressure(alt, v)

C_N = N/(Q*S_ref)
C_N_alpha = C_N/alpha

print(C_N_alpha)
C_{N_\alpha} = 161.69
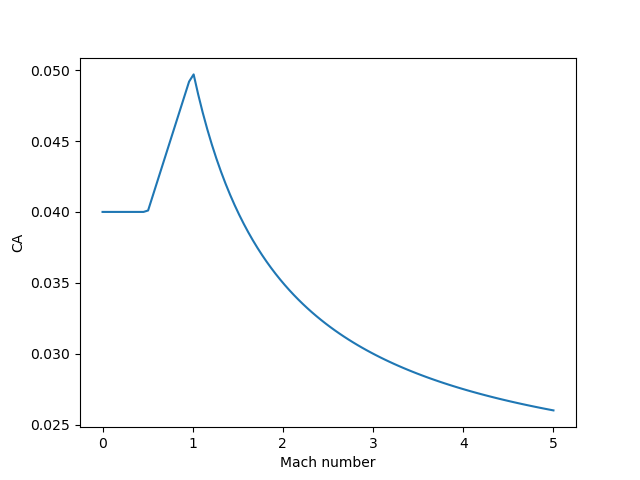
Develop an Axial Drag Model
import numpy as np
import matplotlib.pyplot as plt

def CA(Mach):
    return np.where(Mach > 1.0, 0.02 + 0.03/Mach,
           np.where(Mach > 0.5, 0.02*(Mach-0.5) + 0.04, 0.04))


def main():
    Mach = np.linspace(0,5,100)
	plt.savefig("axial_drag.png")
    plt.plot(Mach, CA(Mach))
    plt.show()


if __name__ == "__main__":
    main()
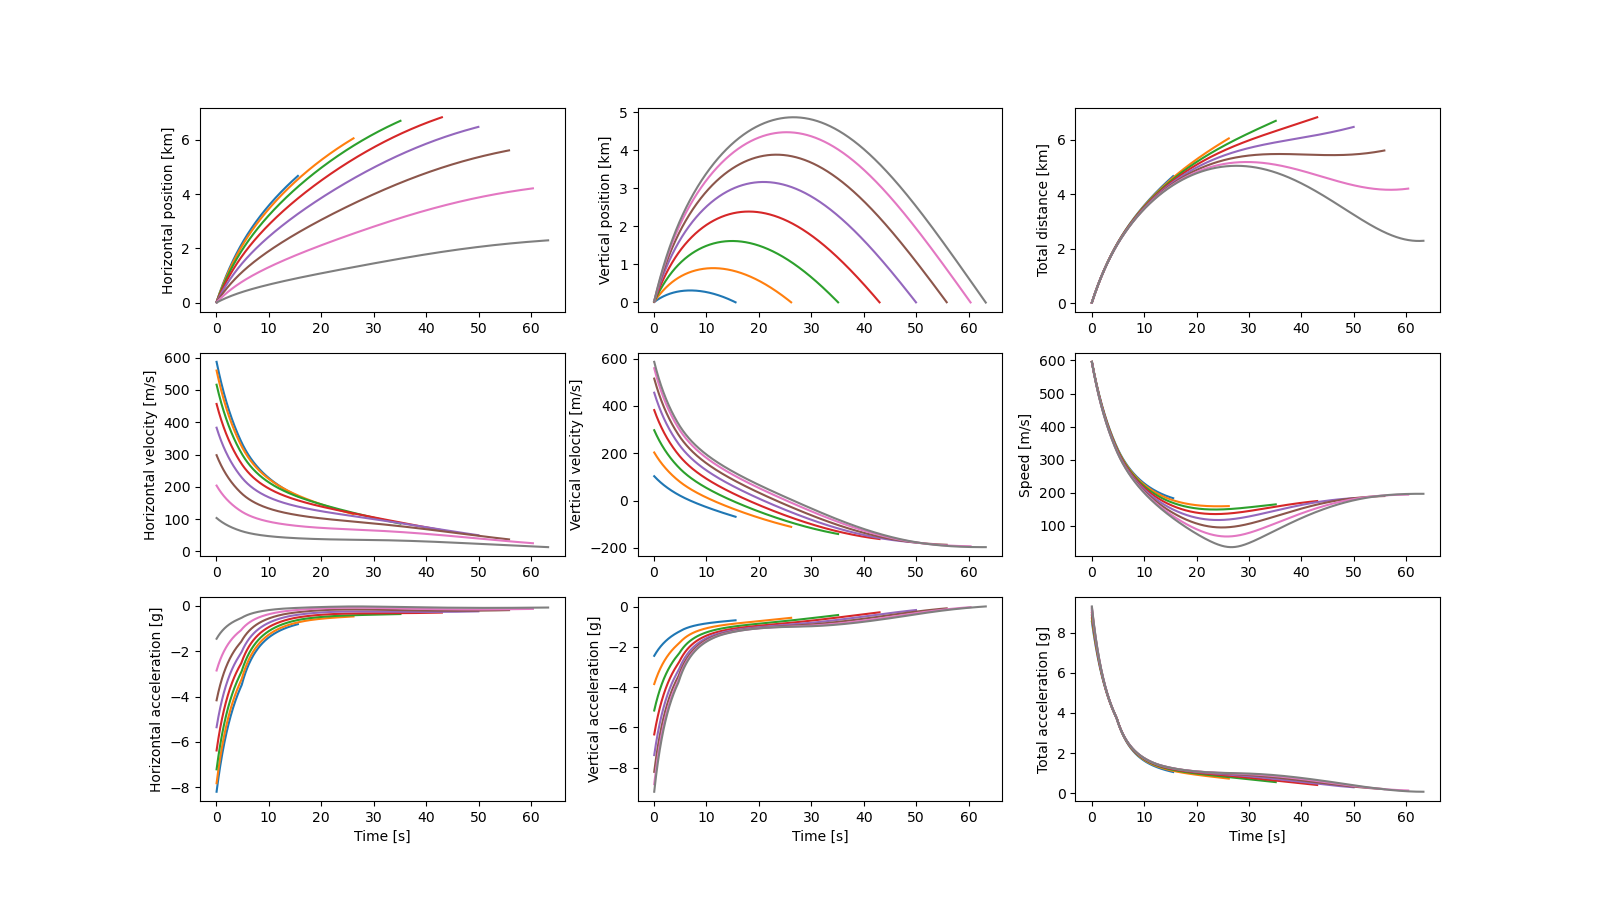
Cannonball
import atmospheric_model as atmos
import axial_drag
import numpy as np
import matplotlib.pyplot as plt

IGNORE_AIR_RESISTANCE = False

g = -9.81
v_initial = 600
S_ref = 0.1
mass = 10
T_s = 0.05

def main():
    for elevation in np.arange(10,81,10):
        theta = np.radians(elevation)
        v_x = v_initial * np.cos(theta)
        v_y = v_initial * np.sin(theta)
        a_x = 0
        a_y = g

        t = 0
        x = 0
        y = 0

        x_values = []
        y_values = []
        x_velocities = []
        y_velocities = []
        x_accelerations = []
        y_accelerations = []
        time = []

        while y >= 0:
            t += T_s

            if not IGNORE_AIR_RESISTANCE:
                v = (v_x*v_x + v_y*v_y)**0.5

                Mach = atmos.Mach(y, v)
                CA = axial_drag.CA(Mach)
                Q = atmos.dynamic_pressure(y, v)
                drag = CA*Q*S_ref

                angle = np.arctan(v_y/v_x) + np.pi
                drag_x = drag*np.cos(angle)
                drag_y = drag*np.sin(angle)

                a_x = drag_x/mass
                a_y = drag_y/mass + g

            x_accelerations.append(a_x)
            y_accelerations.append(a_y)

            x += v_x*T_s
            x_values.append(x)
            y += v_y*T_s
            y_values.append(y)

            v_x += a_x*T_s
            x_velocities.append(v_x)
            v_y += a_y*T_s
            y_velocities.append(v_y)

            time.append(t)

        x_pos = np.array(x_values)/1000
        y_pos = np.array(y_values)/1000
        distance = (x_pos*x_pos + y_pos*y_pos)**0.5

        v_x = np.array(x_velocities)
        v_y = np.array(y_velocities)
        speed = (v_x*v_x + v_y*v_y)**0.5

        a_x = np.array(x_accelerations)/9.81
        a_y = np.array(y_accelerations)/9.81
        acceleration = (a_x*a_x + a_y*a_y)**0.5

        plt.subplot(331)
        plt.plot(time, x_pos)
        plt.ylabel("Horizontal position [km]")

        plt.subplot(332)
        plt.plot(time, y_pos)
        plt.ylabel("Vertical position [km]")

        plt.subplot(333)
        plt.plot(time, distance)
        plt.ylabel("Total distance [km]")

        plt.subplot(334)
        plt.plot(time, v_x)
        plt.ylabel("Horizontal velocity [m/s]")

        plt.subplot(335)
        plt.plot(time, v_y)
        plt.ylabel("Vertical velocity [m/s]")

        plt.subplot(336)
        plt.plot(time, speed)
        plt.ylabel("Speed [m/s]")

        plt.subplot(337)
        plt.plot(time, a_x)
        plt.ylabel("Horizontal acceleration [g]")
        plt.xlabel("Time [s]")

        plt.subplot(338)
        plt.plot(time, a_y)
        plt.ylabel("Vertical acceleration [g]")
        plt.xlabel("Time [s]")

        plt.subplot(339)
        plt.plot(time, acceleration)
        plt.ylabel("Total acceleration [g]")
        plt.xlabel("Time [s]")

    plt.savefig("cannonball.png")
    plt.show()


if __name__ == "__main__":
    main()